Skip to content

Equity research, made clearer

Know what matters. Verify why.

Read the filing. Check the numbers. See the news that matters. Every conclusion stays close to its source.

Free account · No card required

5,800+public companies covered
300+metrics to chart, screen and compare
170K+earnings call transcripts on file
40M+13F positions across 20 quarters

Pricing

Start free. Upgrade when you need more room.

Free

A clear place to start researching companies.

$0 forever
  • 3 years of financial statements
  • Screener: 25 results per screen
  • 30 days of company news
  • 30 chat messages / month
  • 4 filing analysis credits / month
  • 2 earnings call analyses / month
  • 10 news analyses / month
Start free

No card required

Pro

For deeper, higher-volume fundamental research.

$41.58 / month, billed yearly
  • Full financial history
  • Screener: every result
  • Full news history
  • 2,000 chat messages / month
  • 150 filing analysis credits / month
  • 100 earnings call analyses / month
  • 600 news analyses / month
Choose Pro

$499 billed once a year. 14-day money-back guarantee. Save 17%.

  • 7-day free trial on Researcher
  • 14-day money-back guarantee on your first payment
  • Cancel anytime
  • Secure checkout, card details never touch our servers

New features ship every week, and every plan gets them. Sales tax, where it applies, is added at checkout.

Compare plans

Everything below comes from each plan's settings — the same rules the product enforces.

Features Free $0 Researcher $24.92 / month, billed yearly Pro $41.58 / month, billed yearly
AI research
Research ChatSource-linked answers across filings, financials, calls and news
Chat messagesPer month 30 500 2,000
Pick filings for a chatChoose which 10-K / 10-Q documents it reads —
Documents per message — 3 10
ReflexSame questions across many companies Preview
Filings & earnings calls
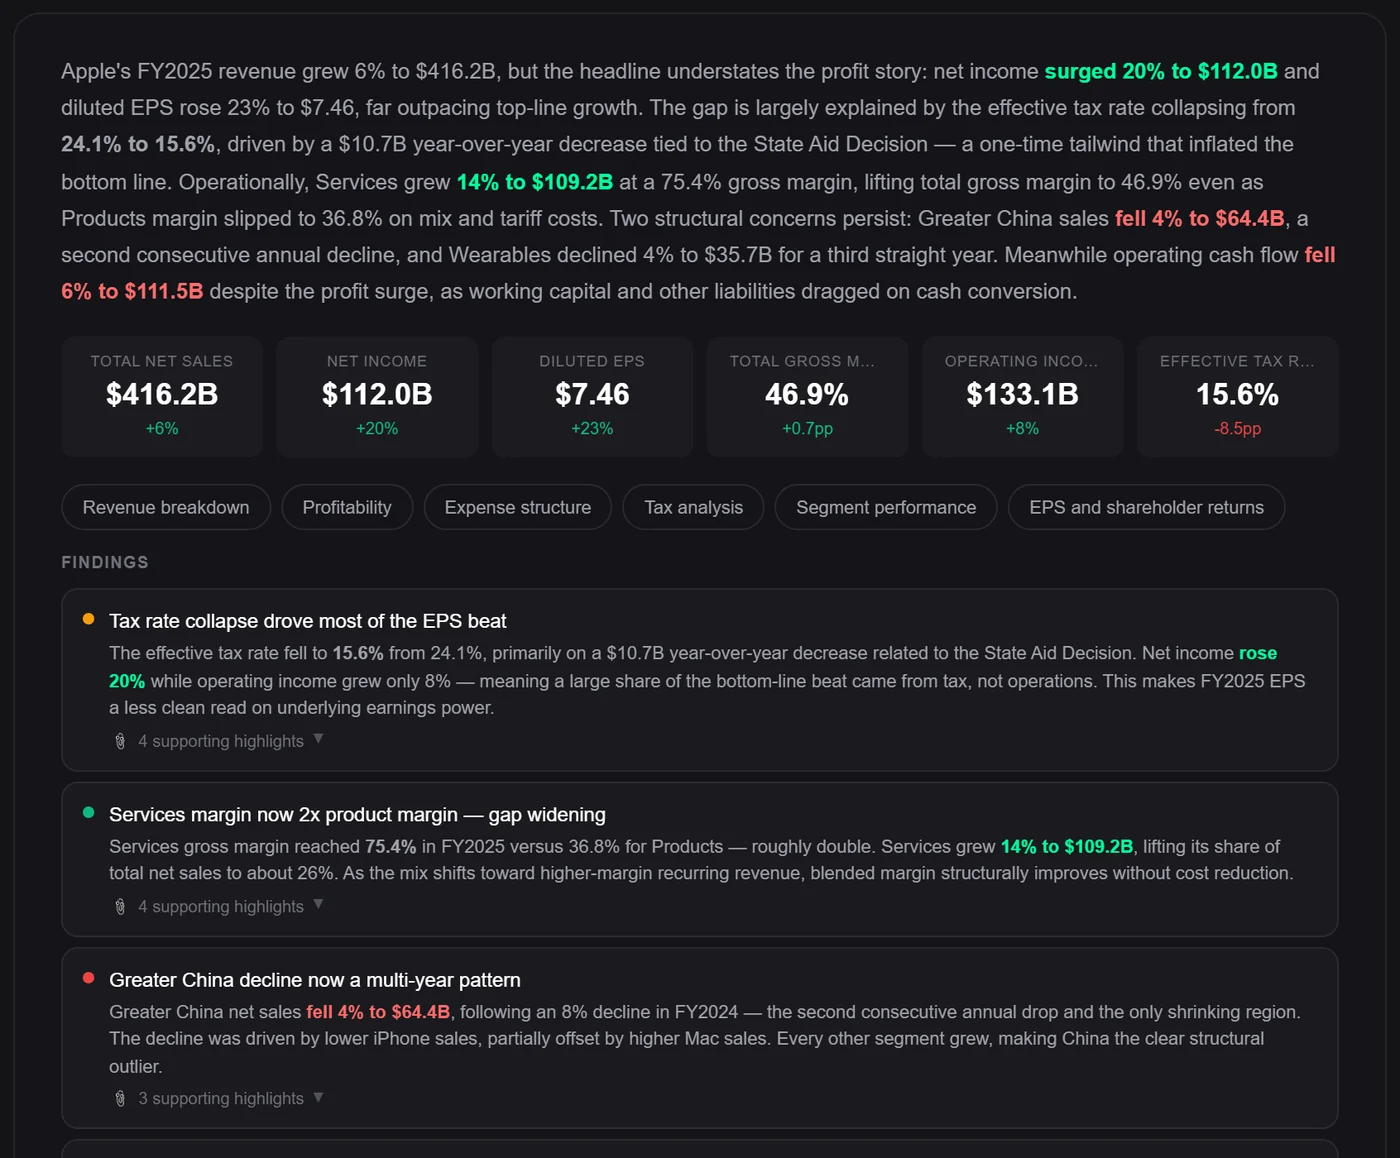
10-K & 10-Q analysesSeven lenses, findings and charts Preview
10-K analyses per companyMost recent years you can open 2 Unlimited Unlimited
10-Q analyses per companyMost recent quarters you can open 4 Unlimited Unlimited
Open filing analysesPer month; each stays open for 30 days 4 Unlimited Unlimited
Request new filing analyses
Filing analysis creditsPer month; a 10-K takes 3, a 10-Q takes 1 4 40 150
Earnings call AIGuidance, graded Q&A, red flags Preview
Call transcripts
Open earnings call analysesPer month 2 Unlimited Unlimited
New earnings call analysesPer month 2 25 100
News
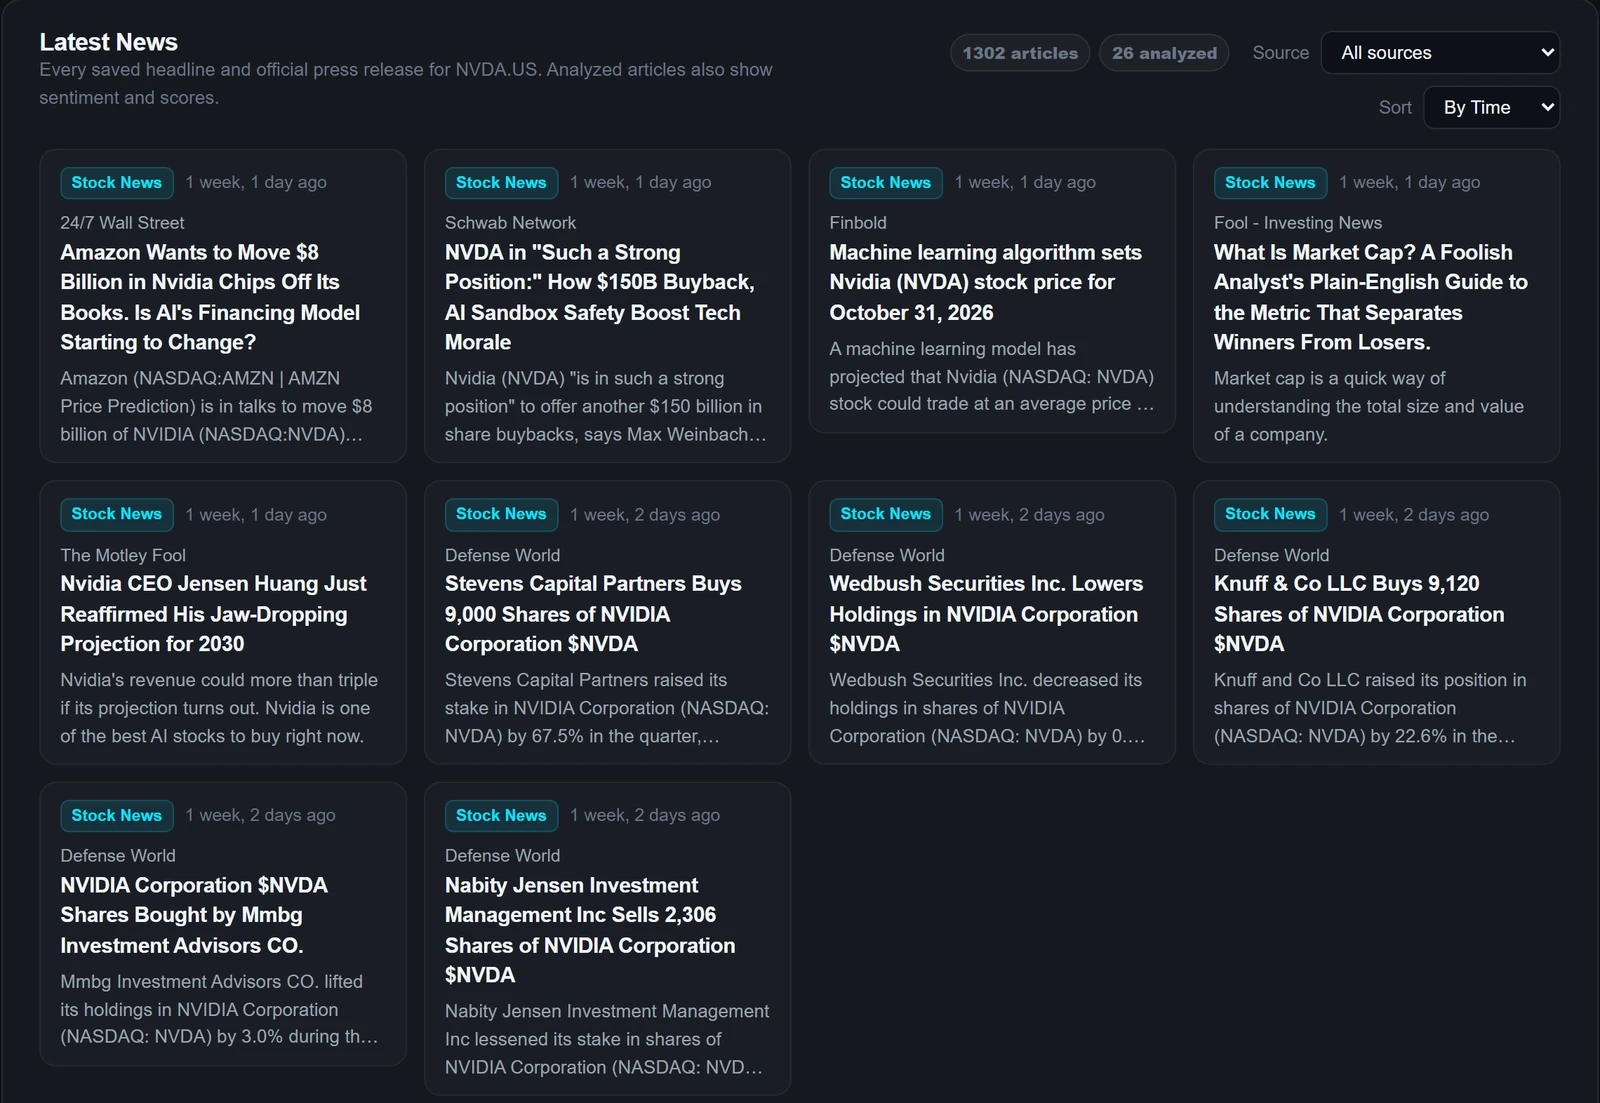
AI ticker news readSummary, bull case, bear case, watch list Preview
Analyze a single article
Article analysesPer month 10 150 600
Advanced news sortingBy score or weighted —
News historyDays 30 365 Unlimited
Data & analysis tools
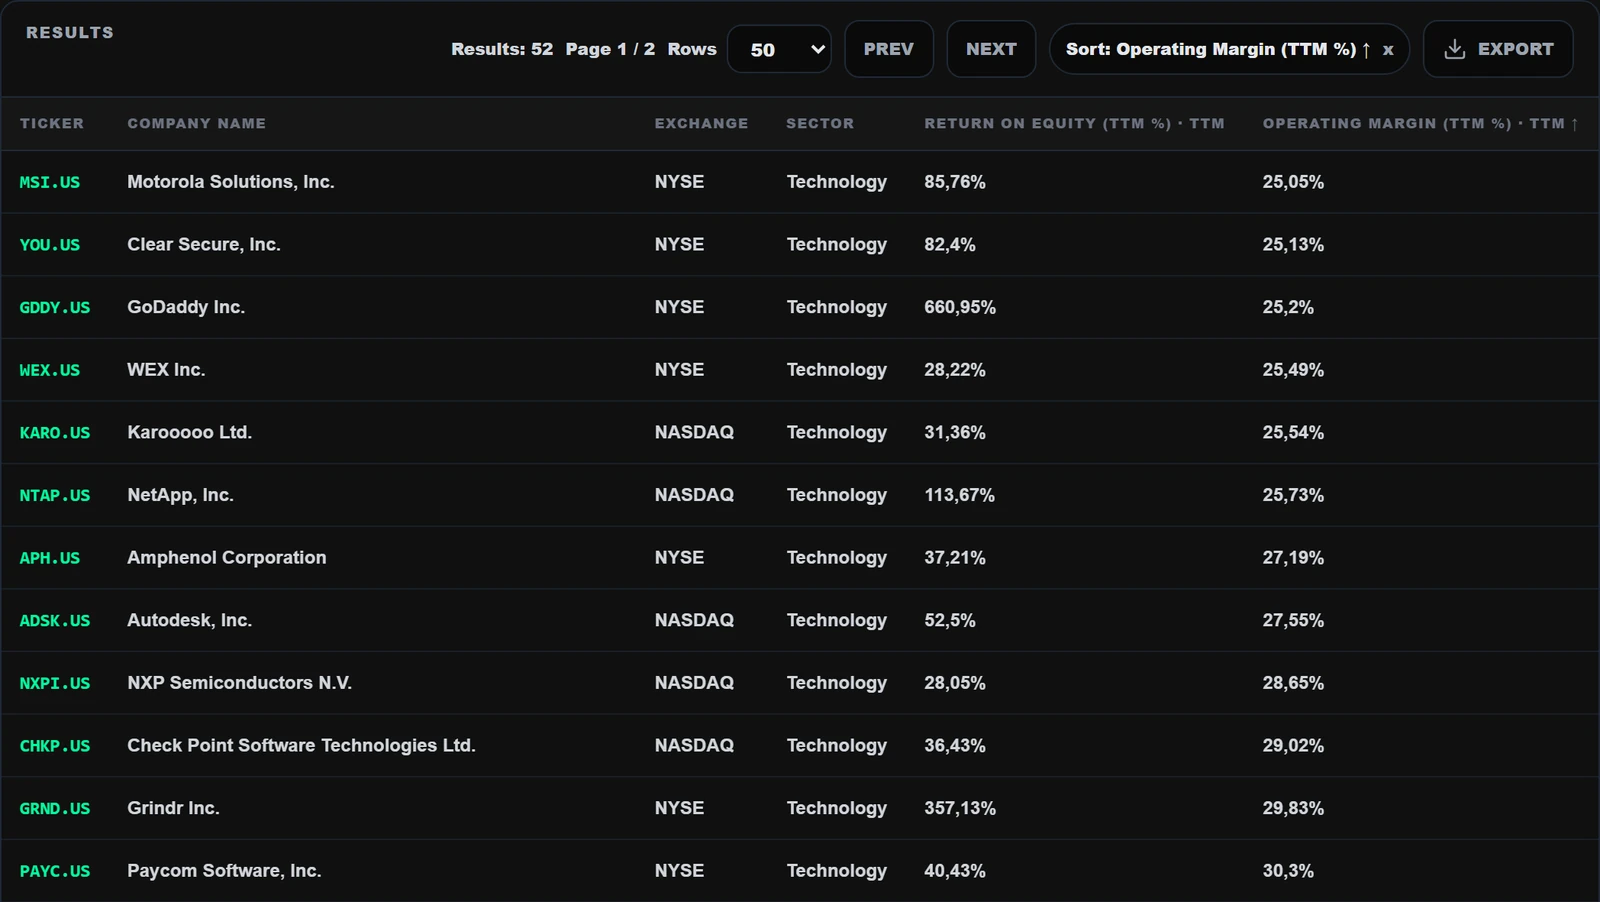
Stock Screener
Active screener filters 3 15 Unlimited
Saved screens 1 20 Unlimited
Custom metricsBuild your own ratios —
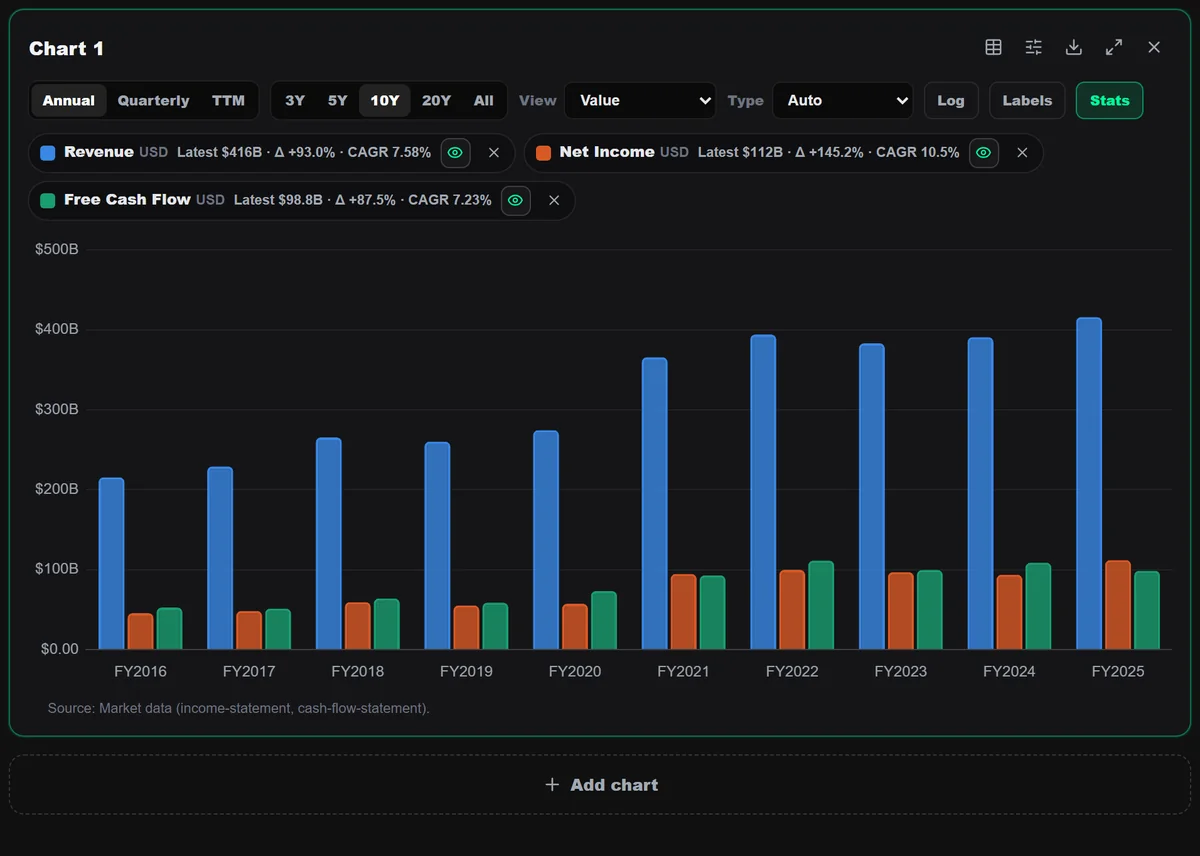
Chart Builder300+ metrics
Companies per chart 1 5 Unlimited
Saved charts 2 25 Unlimited
Peer ComparisonRank, map and trend
Peer universeCompanies per comparison 5 15 Unlimited
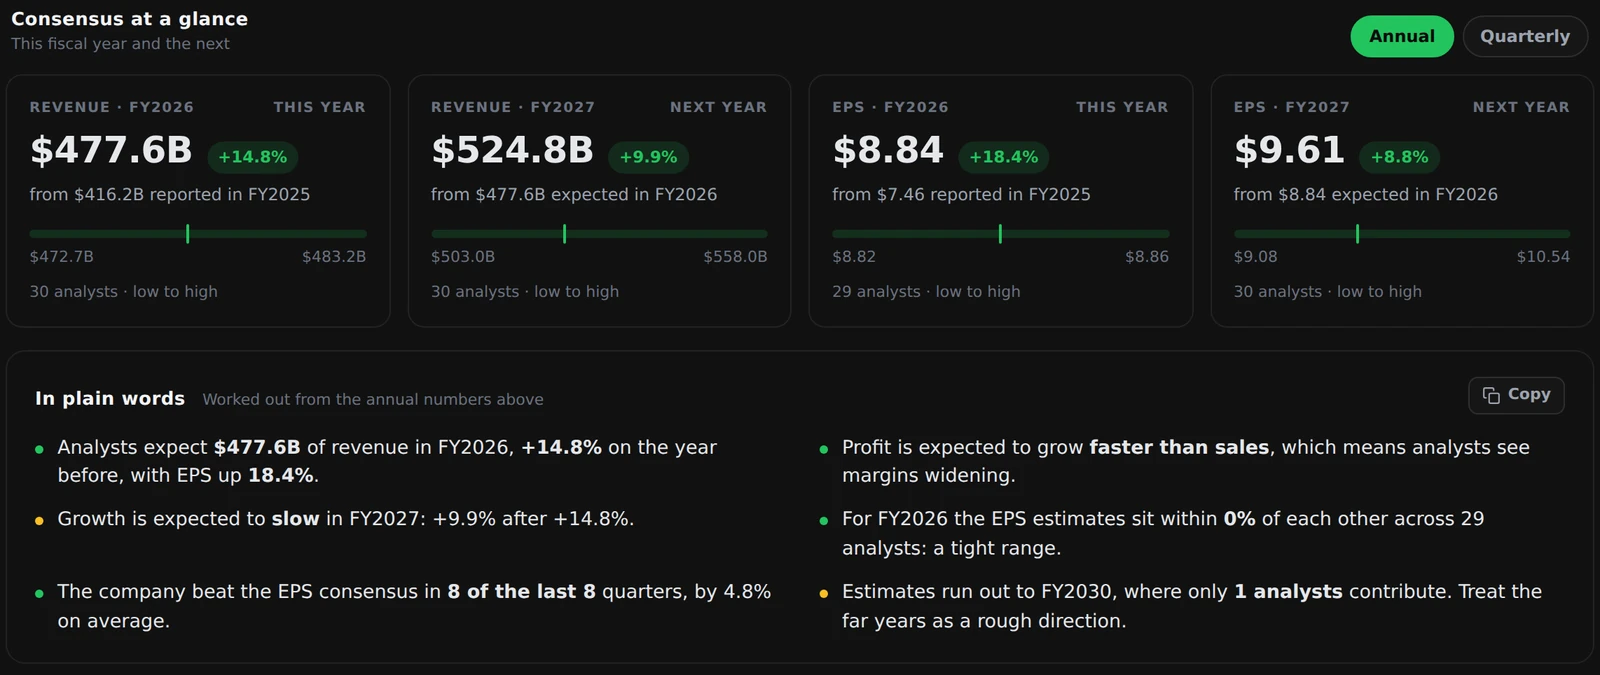
Analyst viewConsensus estimates, analyst disagreement, earnings record Preview
DCF valuation —
Sensitivity analysis —
Valuation runsPer month — Unlimited Unlimited
Annual financial historyYears 3 10 Unlimited
Ownership & Congress
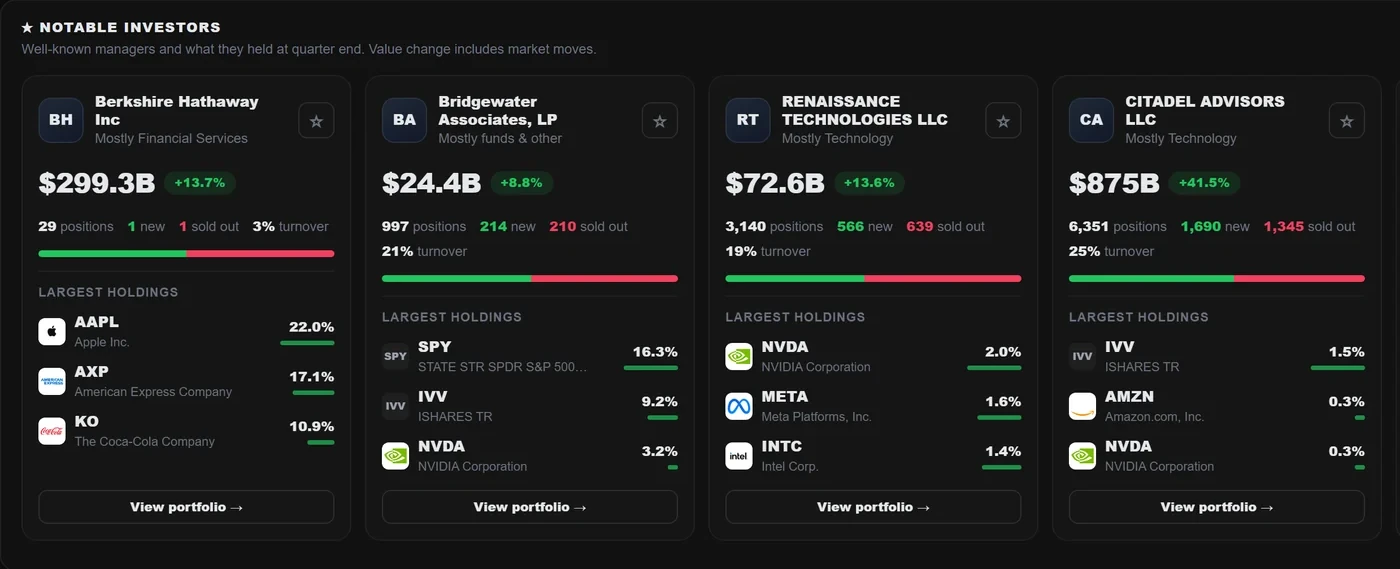
Institutional holdings (13F)
13F historyQuarters 4 12 Unlimited
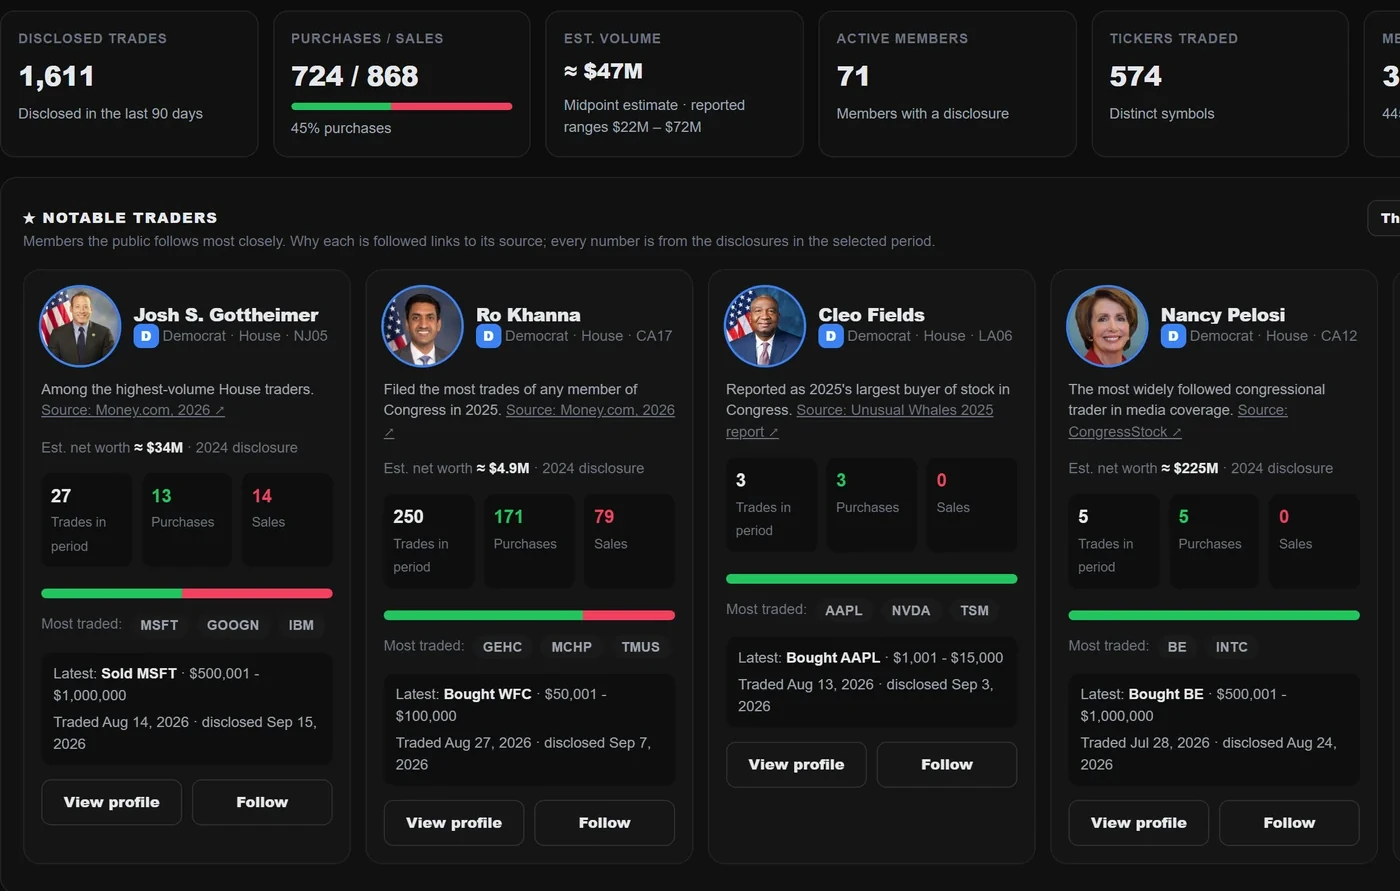
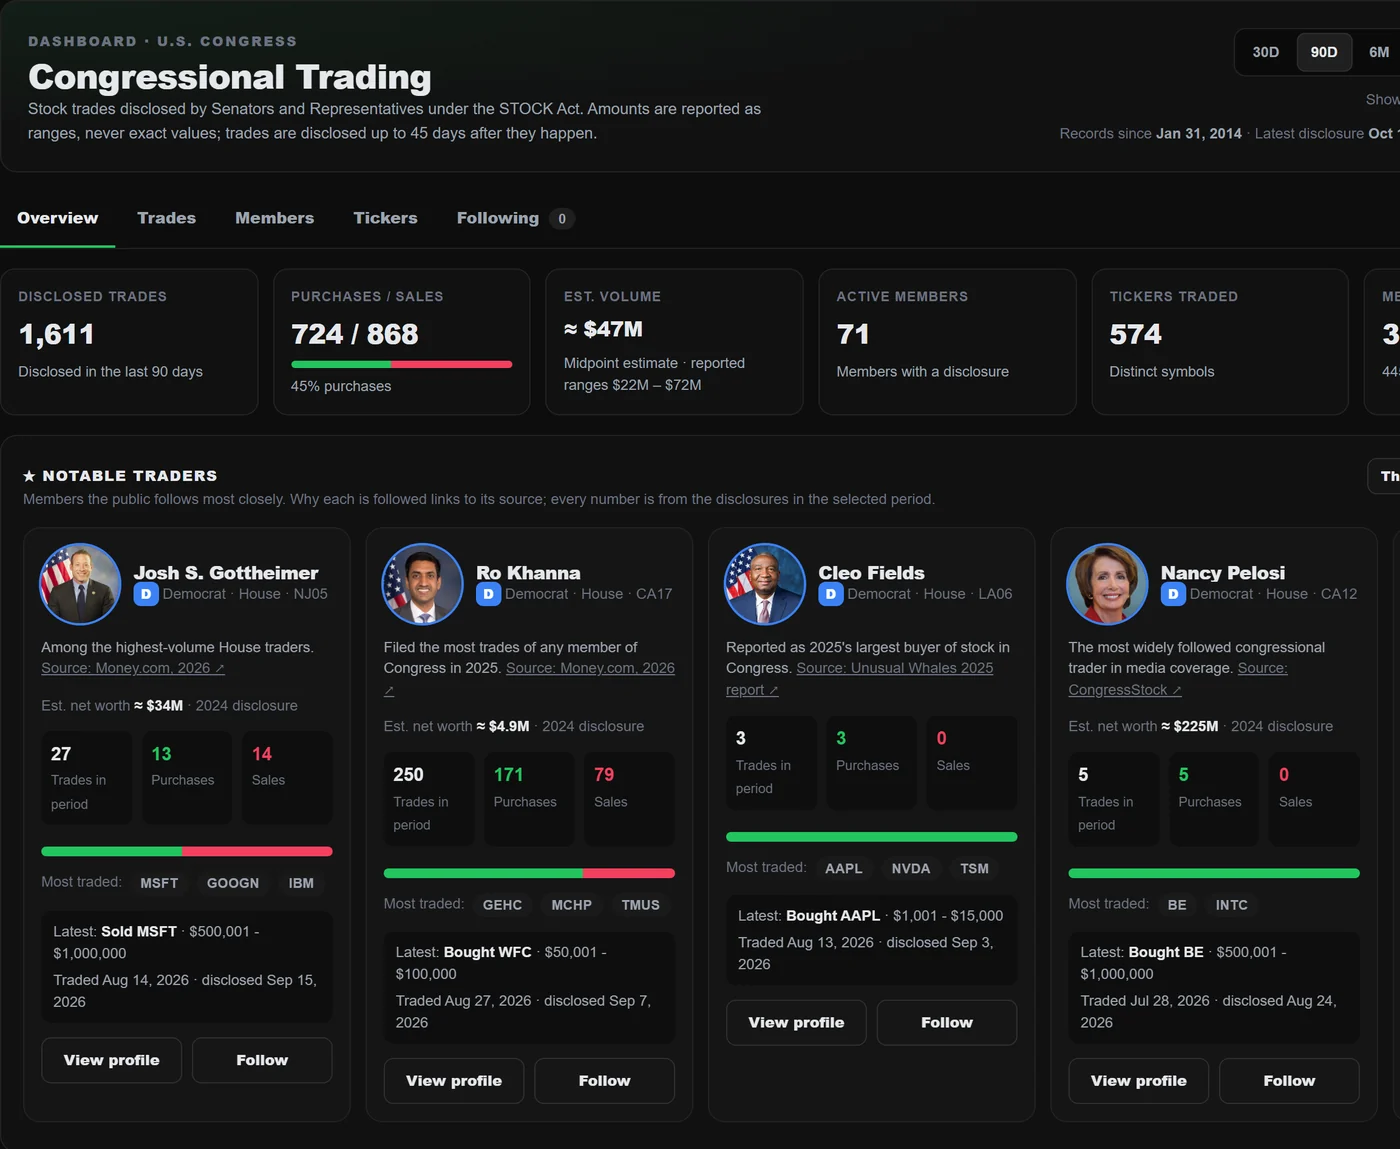
Congressional trading
Follow members
Workspace & reports
Watchlists 1 10 50
Tickers per watchlist 20 100 500
Research reportsSector templates —
Your own report templates —
Report snapshots — 10 50
Share reports and templates —
Exports
Image exportCharts and cards as PNG / JPG
Table exportExcel / CSV —
Report PDF —

Questions

Clarity before you begin.

Is this investment advice?

No. FinKut helps you organize and investigate public information. It does not provide personalized investment advice or a recommendation to buy or sell a security.

How does source verification work?

Where a research view has source context available, the workflow keeps the underlying filing, financial period or related news item close to the conclusion so you can review it yourself.

What data is included?

Available coverage varies by company, exchange, provider and product area. The product keeps the relevant source and period close as you research a company.

How current is the data?

Filings, financials, market context and news have different source update cycles. Research views show relevant reporting periods or update context rather than imply a universal timestamp.

What is the difference between 10-K and 10-Q analysis?

A 10-K establishes annual business and risk context. A 10-Q focuses on what changed during the latest reporting period and how it affects the ongoing thesis.

How do plan limits work?

Limits vary by plan and research activity. The table reflects the current plan catalog; the product explains when a specific feature or quota is unavailable.

Can I track a portfolio and watchlists?

Yes. Available portfolio and watchlist capacity depends on your current plan and account access.

How is my data handled?

Account and product data handling is described in our Privacy Policy. Do not upload or share information you are not authorized to use.
Still have a question? Contact us

Build a clearer view before the market moves on.

For research and informational purposes only — not investment advice.