13F
See what the big money did.
Every manager with over $100M in U.S. equities files a Form 13F within 45 days of quarter end. See notable investors, open any manager's portfolio, follow the biggest buys and sells, and see where the money moved across the market — twenty quarters back.
- Notable investors with their largest holdings
- Manager profiles: value, positions, net buying, concentration, turnover
- Biggest buys and sells, new and sold-out positions
- Sector map of the change in institutional holdings
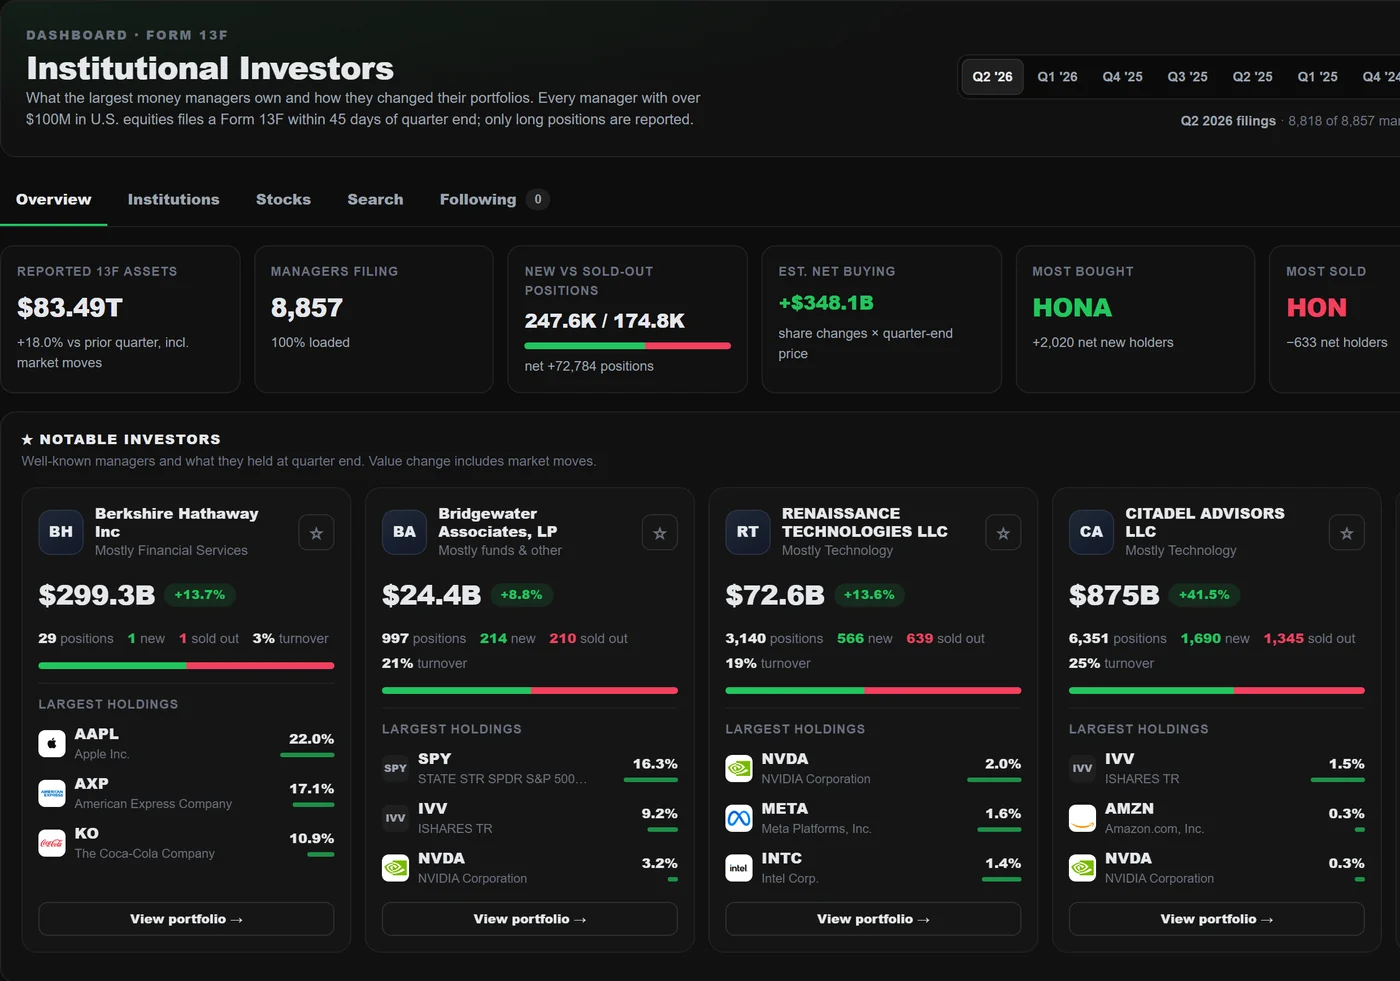
01 — Manager profiles
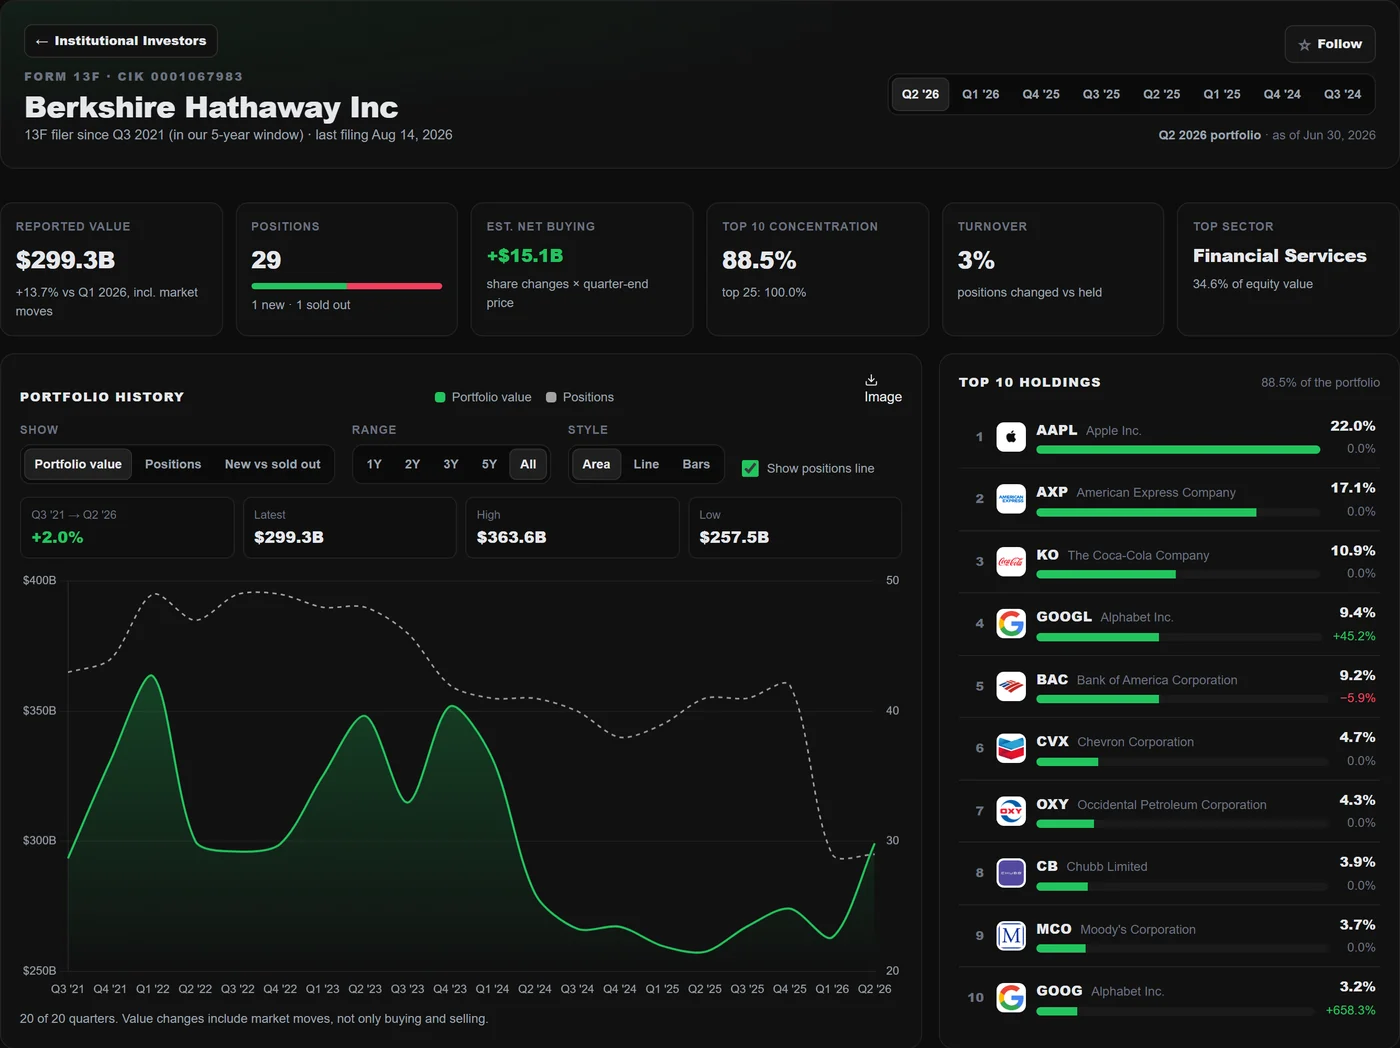
Open any manager's portfolio.
Reported value, positions, estimated net buying, top-10 concentration, turnover and top sector — then the portfolio history and the top ten holdings with their weight and change. Switch quarters across five years and follow the managers you respect.
- Portfolio history by value or positions
- Top holdings with weight and change
- Quarter selector across twenty quarters
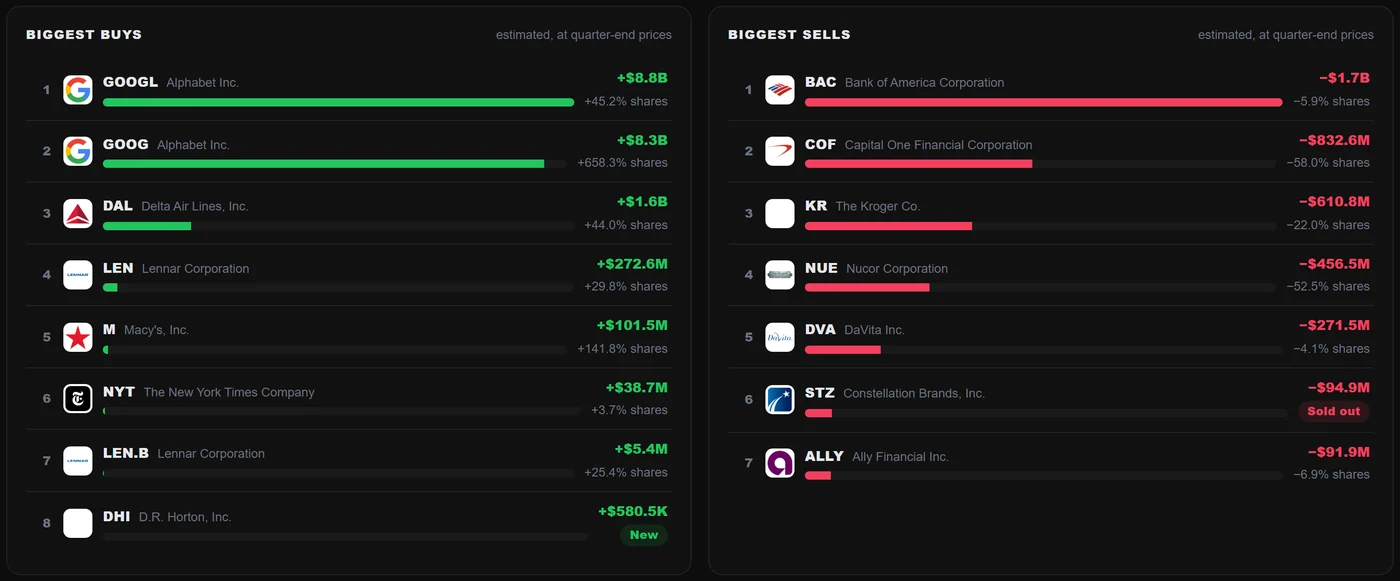
02 — Buys & sells
What they added, what they cut.
The biggest buys and sells of a quarter, estimated from share changes at quarter-end prices, with new and sold-out positions marked. Filter a portfolio to new, added, trimmed or options positions.
- Biggest buys and sells, estimated
- New and sold-out positions
- Filters: new, added, trimmed, options
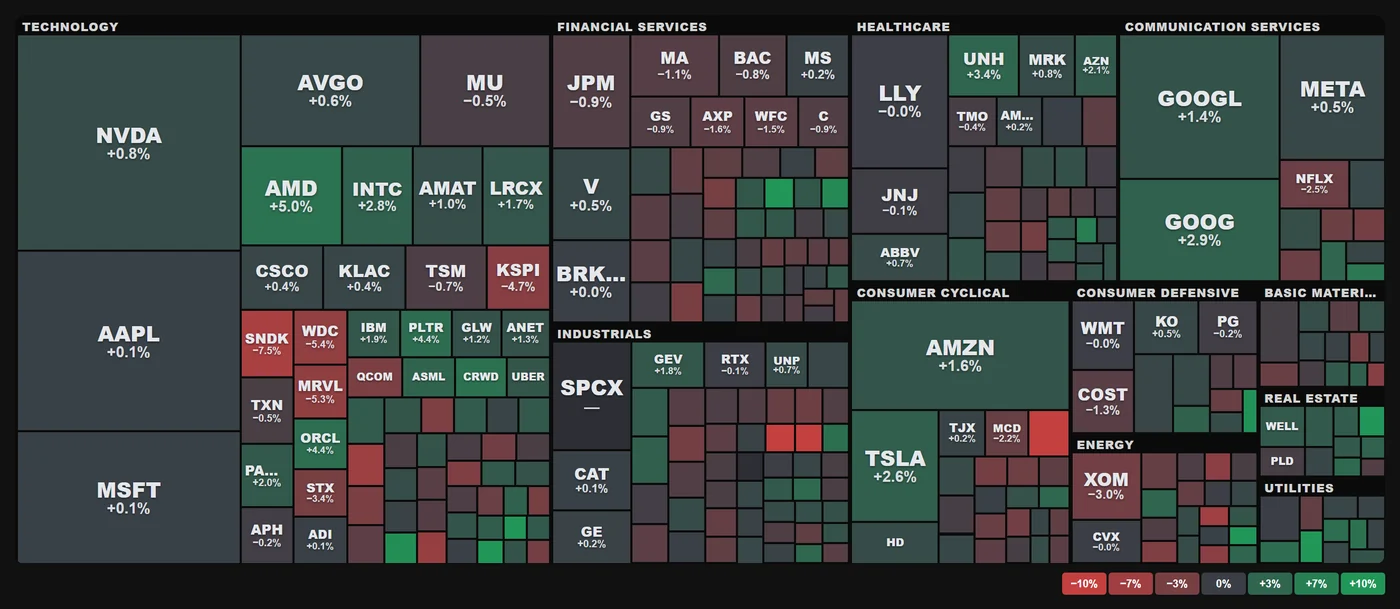
03 — Market map
Where the money moved, on one map.
A sector map of the largest covered stocks coloured by the change in institutional holdings, next to the most bought, most sold and most widely held names. Open any stock to see who owns it and who added or trimmed.
- Sector heat map
- Most bought, most sold, most widely held
- Stock view: holders, ownership %, flows
Also inside
The details that save the afternoon.
Search
Find any filer by name, CIK or a stock ticker.
Following
Keep the managers and stocks you follow in one tab.
Fund families
See other filers in the same family.
Honest timing
13F data arrives up to 45 days after quarter end — the period is always shown.
Value vs. buying
Value changes include market moves; net buying is shares changed × price.
Exports
Charts as images on every plan; tables as CSV on paid plans.
Good to know
Questions about Institutional Holdings.
How current is 13F data?
Managers file within 45 days of quarter end, so 13F always describes the past quarter. Each view shows the reporting period.
Does 13F show short positions?
No. 13F covers long positions in reportable U.S. securities only.
Works with
Keep the thread going.

Build a clearer view before the market moves on.
No credit card required. Verify your email to activate your account.