STOCK Act disclosures
See what Congress is buying and selling.
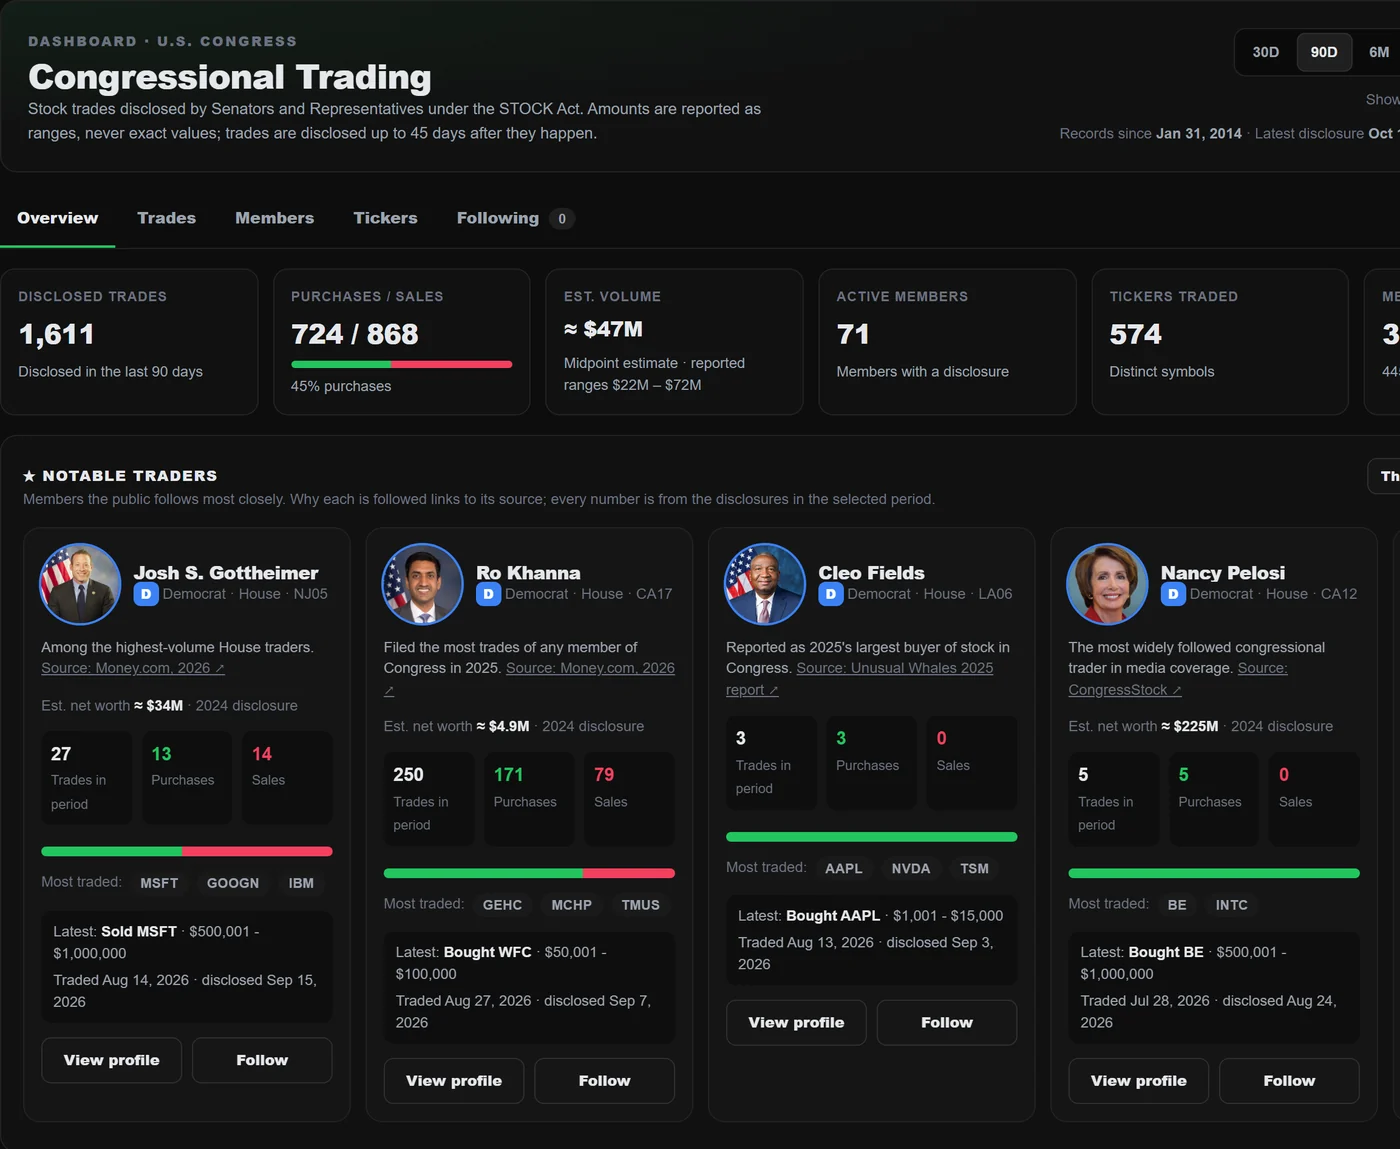
Stock trades disclosed under the STOCK Act, from both chambers. Amounts are shown as the ranges members report — never invented exact values — and every trade shows when it was traded, when it was disclosed and the link to the filing.
- Notable traders with their trades, most-traded names and latest move
- Filter by member, ticker, chamber, party, type and amount
- Traded vs. disclosed date and filing lag on every trade
- Most traded tickers, most active members, sector flow
01 — Trades
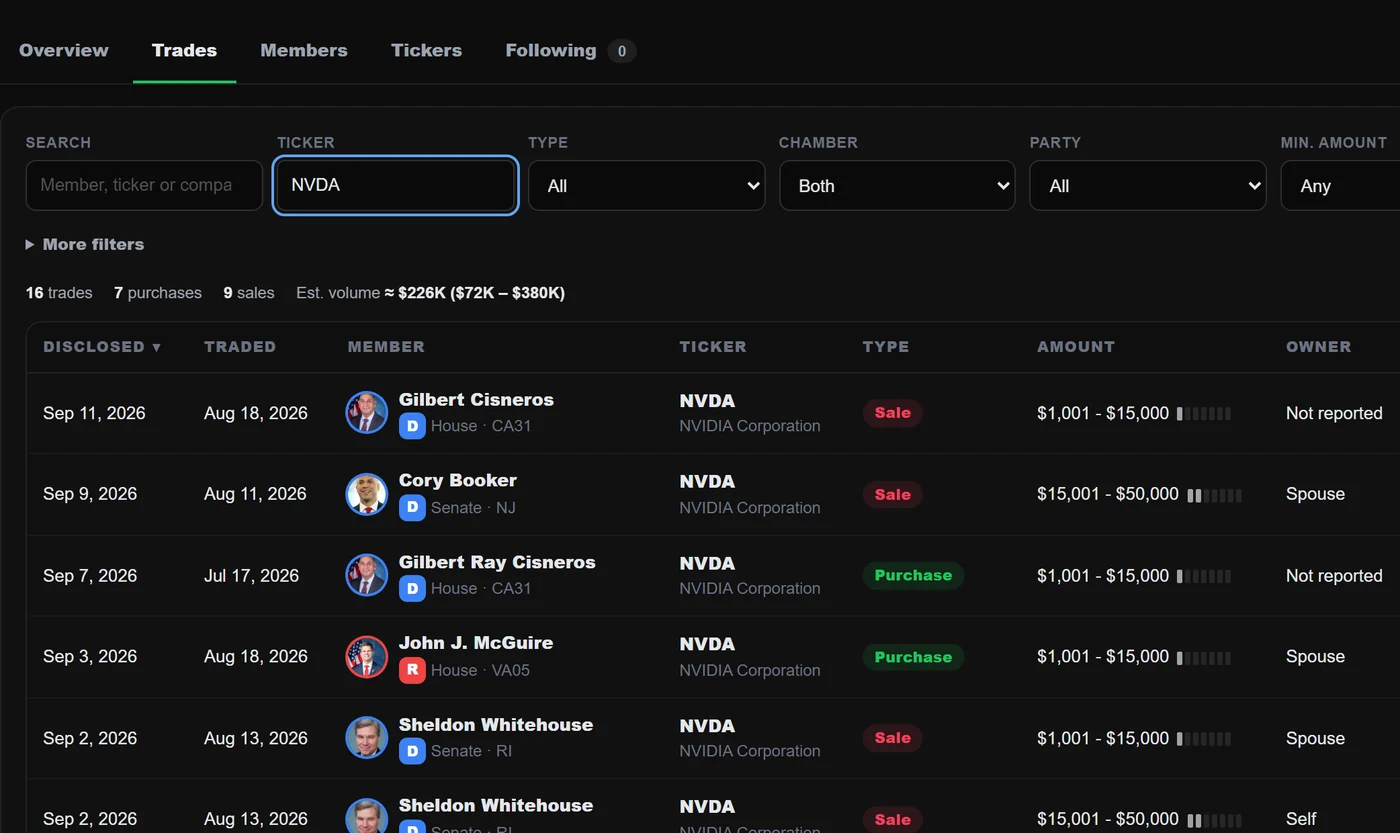
Every disclosure, searchable.
Filter by member, ticker, chamber, party, type, asset and amount; choose whether dates mean traded or disclosed. Each row shows the member, the ticker, the reported amount range, the owner (self, spouse, joint), the filing lag and a link to the original filing.
- Traded vs. disclosed date and filing lag
- Reported amount ranges, owner and type
- View the original filing
02 — Tickers & members
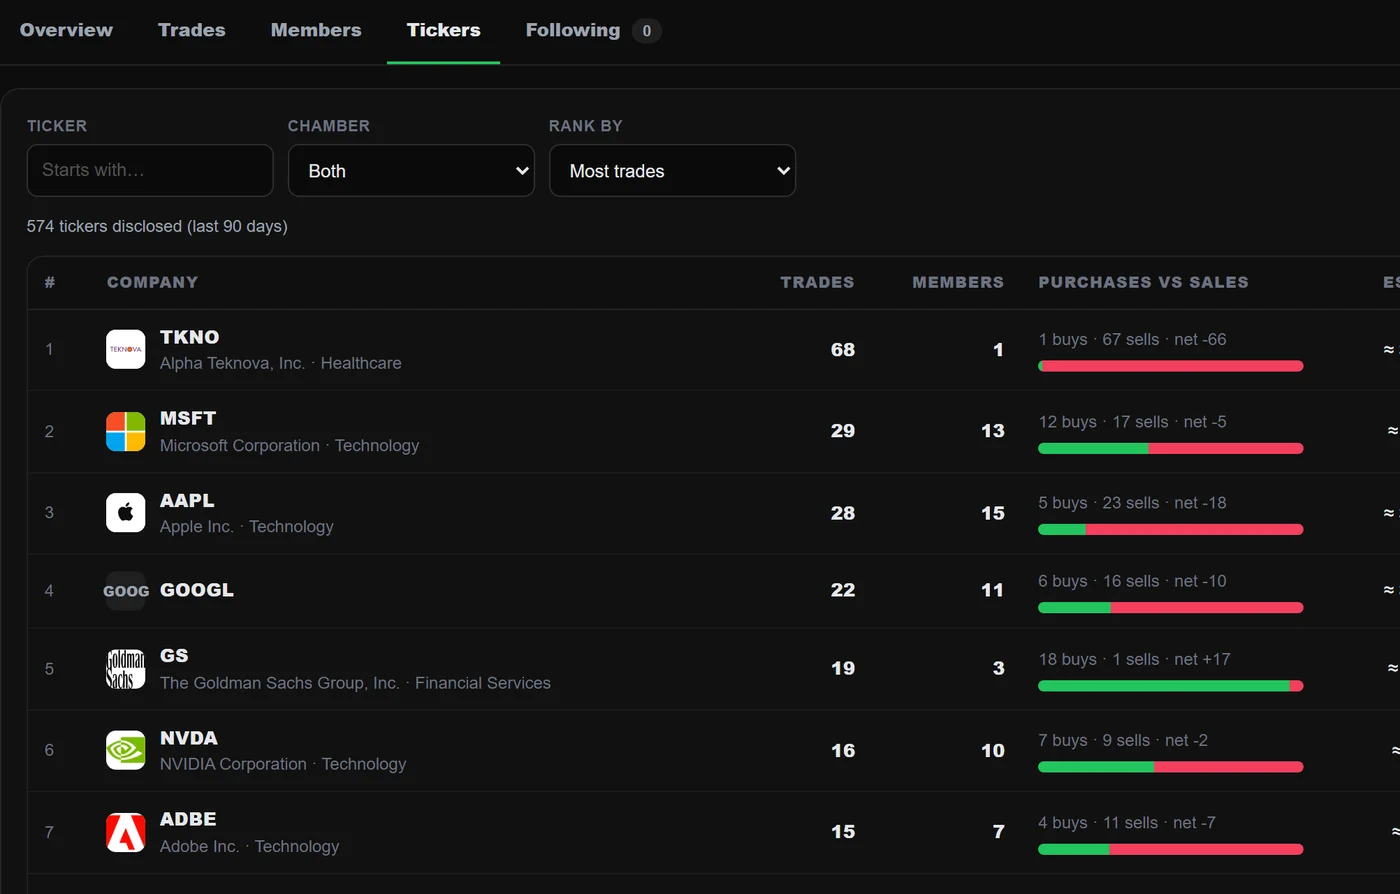
What is being traded, and by whom.
The most traded companies with their buy/sell balance, members and estimated volume range; the most active members; sector flows and the latest disclosures. Open a member or ticker for its detail view, and follow members to see their new filings first.
- Most traded tickers with buy/sell balance
- Most active members and sector flow
- Follow members
Also inside
The details that save the afternoon.
Period control
30 days to all history, or a custom range.
Monthly activity
Purchases vs. sales, month by month.
Who is trading
Trades split by party and chamber.
Notable traders
Members the public follows most — each reason sourced.
Estimated volume
A midpoint estimate, always with the reported range next to it.
Filing lag
Median lag and trades filed after 45 days, counted.
Good to know
Questions about Congressional Trading.
Why are amounts shown as ranges?
Members report trades in ranges such as $1,001–$15,000. We show the range and only use a midpoint for clearly labelled estimates.
How current is the data?
Trades can be disclosed up to 45 days after they happen — sometimes later. Every trade shows both dates.
Is following a member's trades a strategy?
We show public disclosures for research. Nothing here is investment advice.
Works with
Keep the thread going.

Build a clearer view before the market moves on.
No credit card required. Verify your email to activate your account.