Consensus & DCF
Know the expectations. Then do your own math.
What analysts expect the company to earn, how far apart their estimates are and how often the company has beaten them — then a transparent discounted cash flow model where every assumption is yours to change.
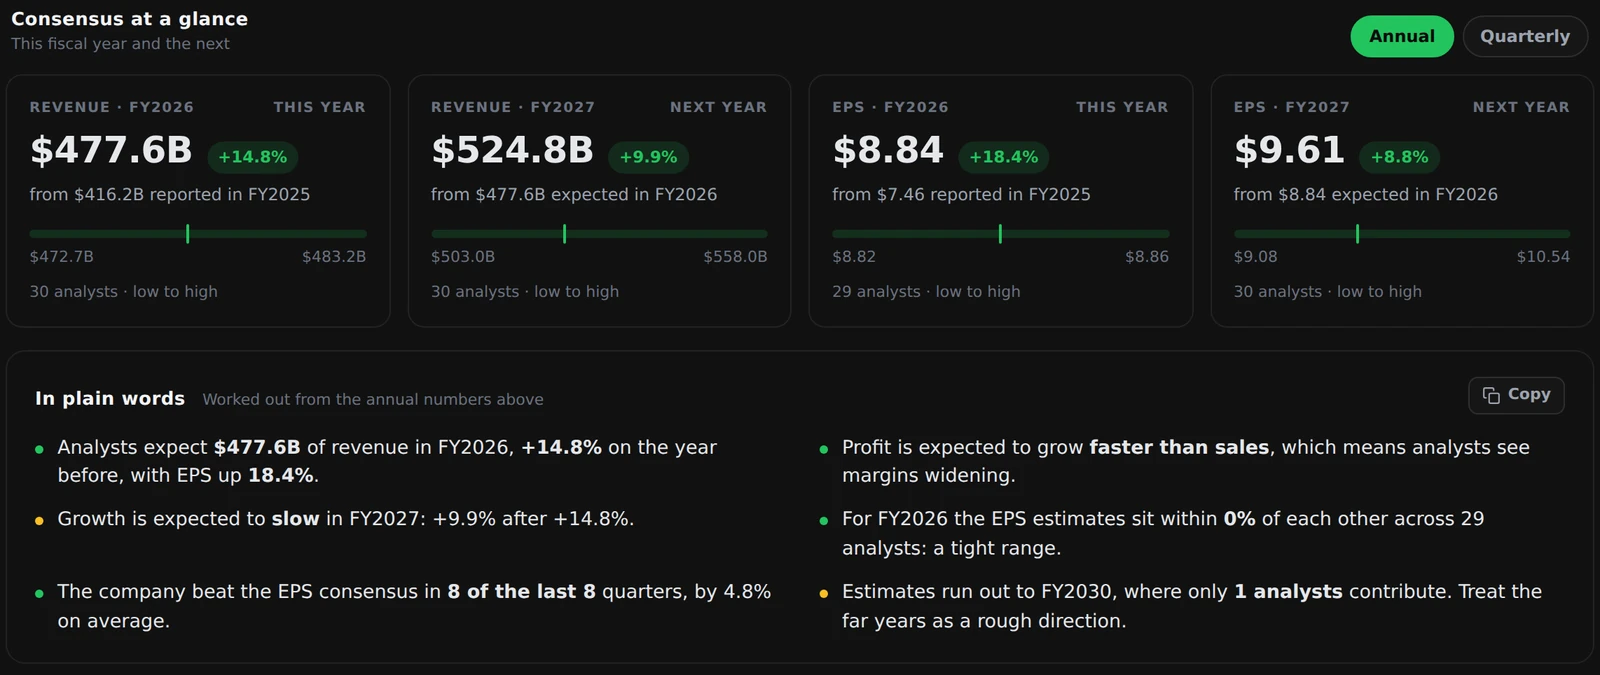
- This year and next: revenue and EPS consensus with the analyst count
- Estimates vs. reported results with low–high range
- DCF with value bridge, cash-flow schedule and sensitivity grid
- Nothing is calculated — and no quota used — until you press Calculate
01 — Estimates vs. results
Consensus next to what was actually reported.
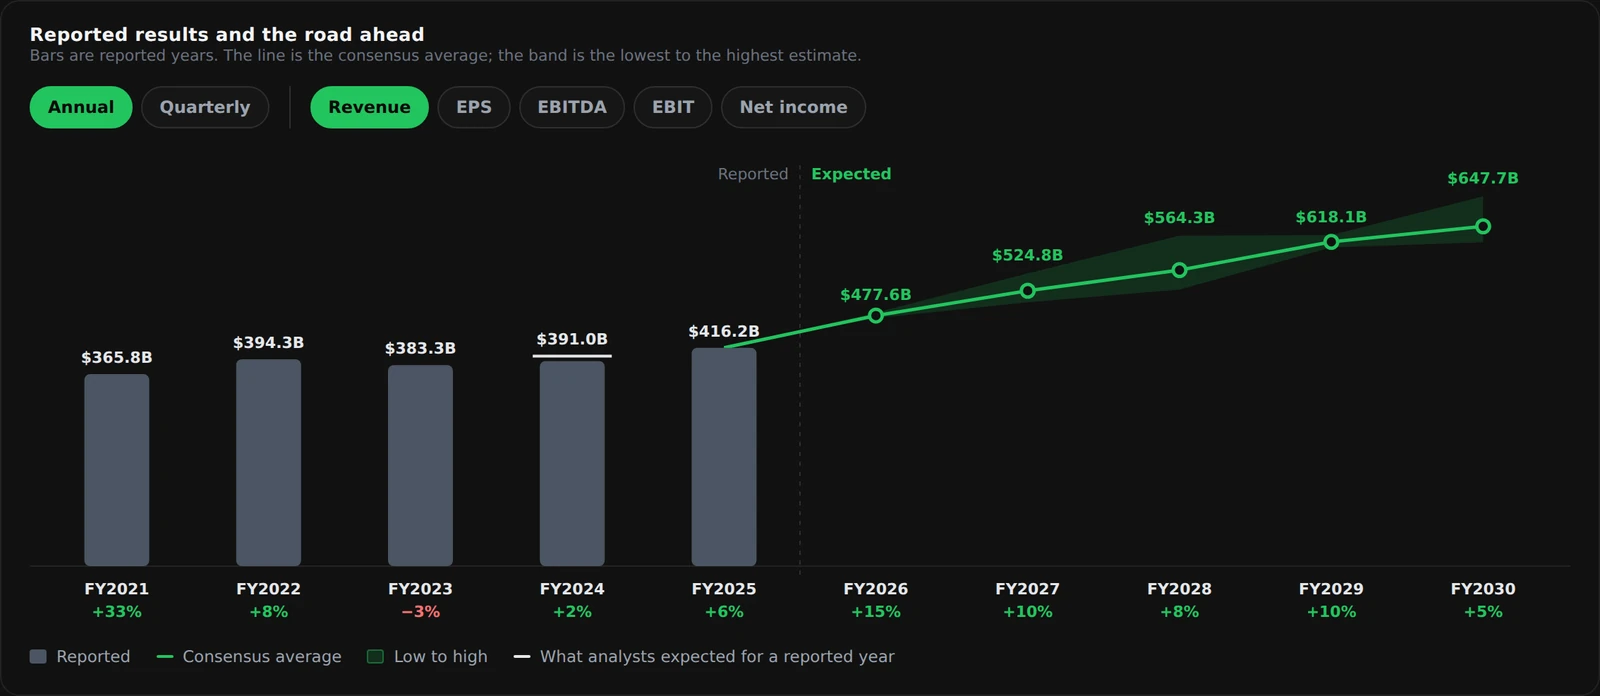
Revenue, EPS, net income, EBITDA and EBIT — annual or quarterly — with the low, average and high estimate and the number of analysts. Once results are in you see the surprise, plus a track record of beats and misses.
- Reported vs. consensus with low–high range
- Earnings track record and beat rate
- Image, Excel and copy on every card
02 — DCF valuation
A valuation you can see through.
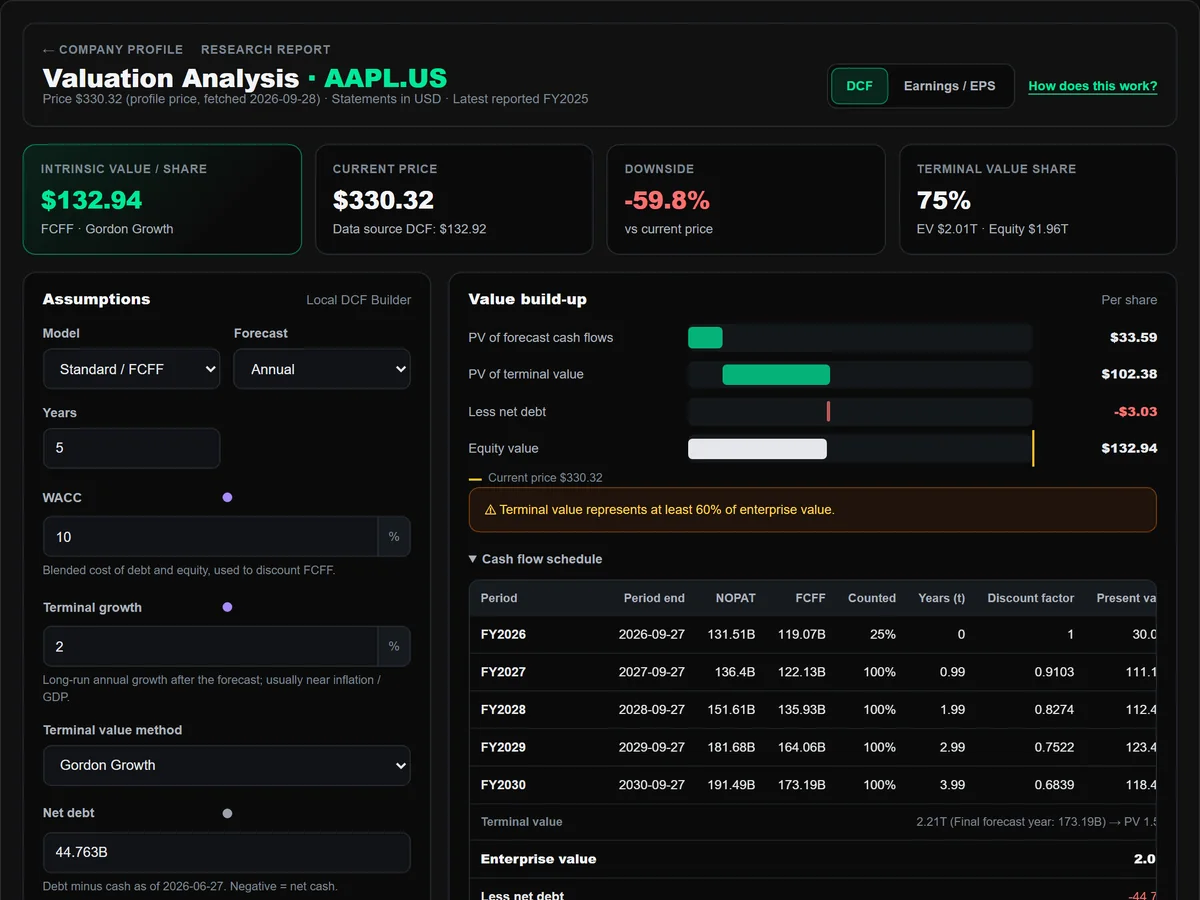
Choose FCFF or FCFE, the years, WACC and terminal growth. The value build-up shows how forecast cash flows, terminal value and net debt add up to a value per share, with the full cash-flow schedule — and a warning when the terminal value carries most of it. Test WACC against growth on a sensitivity grid and save scenarios.
- Assumptions pre-filled from reported data, all editable
- Sensitivity grid, terminal-method comparison
- Saved scenarios; Earnings / EPS model as an alternative
Also inside
The details that save the afternoon.
How much analysts disagree
The gap between the lowest and the highest estimate, year by year.
Implied margins
The profitability the estimates add up to.
Key takeaways
The expectations in plain sentences, ready to copy.
How it works
A built-in guide to the model and its inputs.
Quota-aware
Runs and sensitivity grids count only when you calculate.
Exports
Image on every plan and Excel on paid plans, from each card.
Good to know
Questions about Analyst View & Valuation.
Is the DCF result a price target?
No. It is the output of the assumptions you chose. Change them and the value changes — that is the point.
Where do estimates come from?
Consensus analyst estimates from our market data source, with the date shown.
Works with
Keep the thread going.

Build a clearer view before the market moves on.
No credit card required. Verify your email to activate your account.